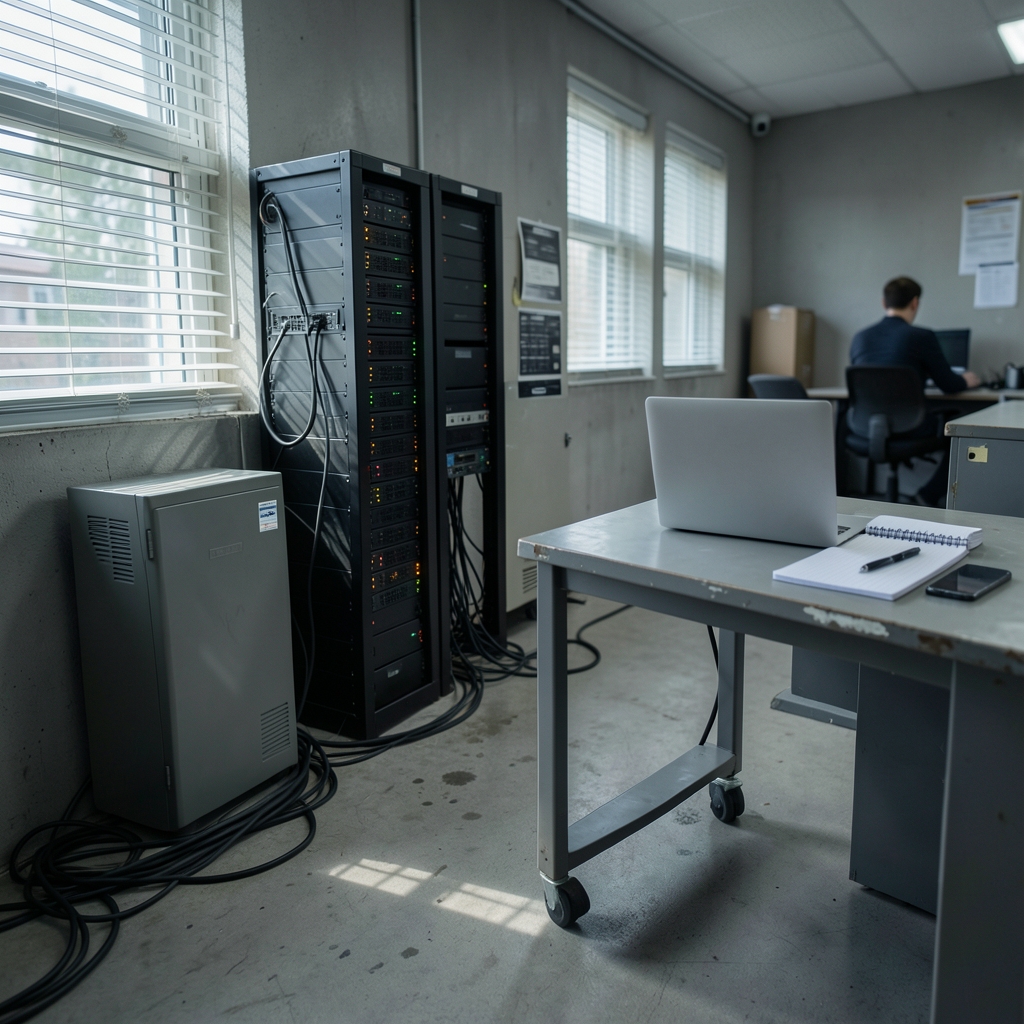
What happens when your checkout page slows to a crawl at 2 a.m., your dashboards show green, and your customers are already tweeting screenshots? That gap between what your tools claim and what your users feel is exactly the problem cloud observability is meant to solve. And it is why picking the right tool matters so much.
The market is crowded. Vendors promise full-stack visibility, AI-powered root cause analysis, and dashboards that practically fix bugs for you. The reality is messier. This guide cuts through the noise and looks at what the best cloud observability tools actually do well, where they fall short, and how to choose without burning your entire infrastructure budget.
What “Observability” Really Means Beyond Marketing
Monitoring tells you whether a system is up. Observability tells you why it is behaving strangely, even when it is technically up. That distinction is not semantic hair-splitting. It changes what you buy.
A truly observable system rests on three signal types: metrics (numeric time series like CPU usage or request latency), logs (timestamped event records), and traces (the path a single request takes across services). Modern platforms increasingly add a fourth: profiling data that shows which lines of code consume the most resources.
The practical test is simple. When something breaks, can you ask a question you never anticipated and get an answer without shipping new code? If yes, you have observability. If you can only view pre-built dashboards, you have monitoring with a fancier label.
The Open Standards Shaping Every Buying Decision

Before comparing vendors, understand the plumbing. OpenTelemetry has become the de facto standard for instrumenting applications and shipping telemetry data. It is vendor-neutral, which means you can collect data once and route it to whichever backend you choose, or to several at once.
This matters enormously for procurement. A few years ago, switching observability vendors meant re-instrumenting your entire codebase. Today, if you build on OpenTelemetry from day one, your backend becomes a commodity decision rather than a decade-long commitment.
Prometheus remains the default for metrics collection in Kubernetes environments, and Grafana is the most common visualization layer on top of it. W3C Trace Context standardizes how trace identifiers propagate between services, which is what makes distributed tracing work across language boundaries.
The practical tip here: instrument with open standards first, then choose a backend. Teams that do this negotiate from strength. Teams that adopt a proprietary agent first often find themselves locked in within eighteen months.
Best Cloud Observability Tools Compared
Here is how the major platforms stack up on the dimensions that actually drive decisions.
| Tool | Strongest At | Typical Fit | Main Trade-off |
|---|---|---|---|
| Datadog | Breadth of integrations, unified dashboards | Mid-size to large teams wanting one vendor | Cost scales steeply with data volume |
| Grafana Cloud | Open-source foundation, flexible data sources | Teams already using Prometheus or Loki | More assembly required |
| Dynatrace | Automated topology mapping, AI-assisted analysis | Complex enterprise estates | Premium pricing, heavier onboarding |
| New Relic | Usage-based pricing, full-stack APM | Startups through mid-market | Bill predictability can be tricky |
| Honeycomb | High-cardinality event analysis | Teams debugging distributed systems | Narrower infrastructure monitoring |
| Splunk Observability | Log analytics depth, security correlation | Organizations already on Splunk | Steep learning curve |
| Elastic Observability | Search-driven exploration, self-hosting option | Teams wanting deployment control | Operational overhead if self-managed |
A few honest observations from watching teams adopt these. Datadog wins a lot of evaluations because it genuinely does everything reasonably well. The trap is that its per-host and per-custom-metric pricing punishes success. Teams often discover this only after a traffic spike doubles their bill. Budget for volume growth before you sign.
Grafana Cloud is the value play, but only if your team is comfortable with some assembly. It is not a turnkey experience. If you want a single pane of glass with zero configuration, it will frustrate you. If you want control and low cost, it is hard to beat.
Honeycomb deserves special mention because it changed how the industry thinks about high-cardinality data. Traditional tools force you to pre-aggregate metrics because storing every unique combination of attributes was expensive. Honeycomb’s event-based model lets you slice by user ID, request ID, or any other dimension after the fact. That capability turns “we think the problem is in the payment service” into “we know it is these 47 users on this specific device type.”
Matching Tools to Your Actual Situation
The best tool is the one your team will actually use at 3 a.m. That sounds glib, but it is the single most reliable filter.
Small teams under ten engineers: Start with a managed platform that bundles metrics, logs, and traces with minimal setup. Grafana Cloud’s free tier or New Relic’s usage-based model lets you get real signal without hiring a platform engineer. Do not self-host anything at this stage. Your competitive advantage is your product, not your observability pipeline.
Mid-size engineering organizations: This is where the build-versus-buy question gets real. If you have platform engineering capacity, an OpenTelemetry collector feeding Prometheus and a managed trace backend gives you leverage. If you do not, a consolidated vendor reduces cognitive load. Be honest about which camp you are in.
Enterprises with complex estates: Automated dependency mapping earns its price when you have hundreds of services and nobody knows what calls what. This is Dynatrace’s core strength. The onboarding effort is real, but so is the payoff in environments where tribal knowledge has walked out the door.
Security-adjacent teams: If your organization already runs Splunk for security operations, consolidating observability there reduces tool sprawl. The correlation between a suspicious login and a latency spike becomes a single query instead of a Slack thread between two teams.
Practical Mistakes That Cost Real Money
The most common error is collecting everything. Teams turn on verbose logging across every service because storage feels cheap. It is not. Log volume is usually the largest line item on an observability bill, and most of it is noise nobody queries.
What works in practice: sample aggressively at the collection layer, keep all traces for errors and a small percentage for successful requests, and set retention policies per signal type. Metrics are cheap to keep for a year. Raw logs rarely justify more than thirty days.
The second mistake is instrumenting without a question in mind. Adding tracing to every service feels productive. But if nobody on the team knows how to query traces during an incident, the data is decoration. Run a game day. Break something on purpose and time how long it takes the team to find it using only the observability stack. That exercise reveals more than any vendor demo.
The third mistake is ignoring the query language. Every platform has one, and it is the real switching cost. A team fluent in one vendor’s query syntax faces weeks of relearning elsewhere. If you are evaluating tools, spend an afternoon with each candidate’s query language on your own data. It is the most predictive trial you can run.
For teams also weighing adjacent purchases, the same discipline applies to AI research tools alternatives that actually fit your workflow and budget rather than the demo. The pattern holds across software categories: the tool that looks best in a sales call is rarely the one that survives contact with production.
Where Pricing Models Break Down
Observability pricing has three common structures, and each hides a different risk.
Per-host pricing is predictable until you scale horizontally. Kubernetes makes this dangerous because pod counts fluctuate wildly.
Per-GB ingestion punishes verbose logging. Teams respond by logging less, which defeats the purpose.
Per-seat pricing discourages sharing dashboards widely, which is exactly the opposite of what you want culturally.
The healthiest approach is to model your expected volume at twelve-month growth before signing anything. Ask vendors for a written estimate at three times your current volume. The answer often changes the decision. A useful companion exercise is comparing affiliate marketing tools pricing comparison flat fees vs usage-based models, because the same flat-versus-variable tension shows up in nearly every SaaS negotiation.
Building a Migration Path That Does Not Hurt
If you are moving from one platform to another, sequence matters more than speed.
- Instrument with OpenTelemetry and send data to both old and new backends simultaneously.
- Run both in parallel for at least one full incident cycle, typically four to six weeks.
- Migrate dashboards and alerts one team at a time, starting with the least critical service.
- Decommission the old pipeline only after a full quarter of clean parallel operation.
The parallel period feels wasteful. It is not. It is the only way to validate that your new stack answers the questions your old one did, plus the ones it could not.
When evaluating competing platforms during a migration, the same rigor used for competitor analysis tools alternatives use instead applies: test against your real workloads, not benchmark suites. And if cost optimization becomes the dominant concern, the logic in free low cost technical seo tools alternatives that actually mirrors what observability teams face, where the cheapest option often carries hidden operational overhead that outweighs the savings.
Conclusion
The best cloud observability tool is not the one with the longest feature list. It is the one your team can query confidently during an outage, at a price that survives your growth curve, built on standards that let you leave if you need to. Start with OpenTelemetry instrumentation, be ruthless about what data you retain, and test every candidate against a real incident rather than a vendor demo. Do those three things and the specific vendor choice becomes far less risky, because you will have built the leverage to change your mind later.
Cost governance is a discipline, not a setting. Even the best-priced platform will drift upward without active management. Assign an owner for observability spend, review the bill monthly against a baseline, and tag every data stream by team and service so chargeback is possible. Teams that can see which service generates which cost make better instrumentation decisions within a week. The teams that cannot usually discover the answer only after finance escalates.
Retention tiers deserve the same scrutiny as ingestion. Most platforms let you route older data to cheaper storage with reduced query speed. That trade-off is almost always worth taking for logs and traces beyond two weeks, because incident investigation rarely reaches back further. Metrics are the exception: keep them long, since capacity planning and trend analysis depend on seasonal comparisons that need a full year of history.
Alert quality beats alert quantity. A stack that pages the on-call engineer forty times a week trains the team to ignore it. Audit your alert rules quarterly, delete anything that fired without requiring action, and route informational signals to dashboards instead of pagers. The measure that matters is the ratio of pages that led to a real fix.
Finally, document your stack. A short runbook covering where each signal lives, how to query it, and who owns each pipeline pays for itself the first time someone joins the rotation. Observability fails quietly when knowledge concentrates in one engineer. Write it down, review it after every incident, and treat the documentation as part of the tooling rather than an afterthought.
Vendor lock-in is a quieter cost than the invoice. Query languages, proprietary agents, and dashboard formats all create switching friction that compounds over years. OpenTelemetry adoption has softened this for instrumentation, but backend portability remains uneven. Before committing, ask each vendor how you would export your historical data and dashboards if you left. The answers range from “one command” to “professional services engagement,” and that gap tells you how much leverage you actually hold. Teams that treat observability as infrastructure rather than a subscription keep that leverage intact—and negotiate from a position of strength when renewal season arrives.




