
Ever punched your hashrate into a mining pool fee calculator, seen a clean profit number, and wondered why the actual payout looked nothing like it? The mismatch has a cause. Those calculators are useful tools, but they also practice selective math: they show one number and leave out five others. This article covers what pool fee calculators actually measure, where the numbers break down, and which risks never appear on screen.
What a Mining Pool Fee Calculator Actually Does
A mining pool fee calculator takes three or four inputs and produces an estimate. Typical inputs include your hashrate, the pool fee percentage, network difficulty, and the block reward. The output is usually a daily, weekly, or monthly earnings figure before electricity.
The math looks simple. Multiply your share of the network by the block reward, then subtract the pool fee. In practice, every one of those variables moves. Difficulty adjusts roughly every 2,016 blocks on Bitcoin, which works out to about two weeks. The block subsidy changes at halvings, most recently in April 2024 when it dropped from 6.25 to 3.125 BTC. Your own hardware may throttle in summer heat.
That means a calculator output is a snapshot, not a forecast. The best ones let you adjust difficulty growth and hashprice assumptions. The worst ones present a single static number as if it were guaranteed. Knowing which kind you are using is the first step toward not being surprised.
The Fee Models Behind the Percentage
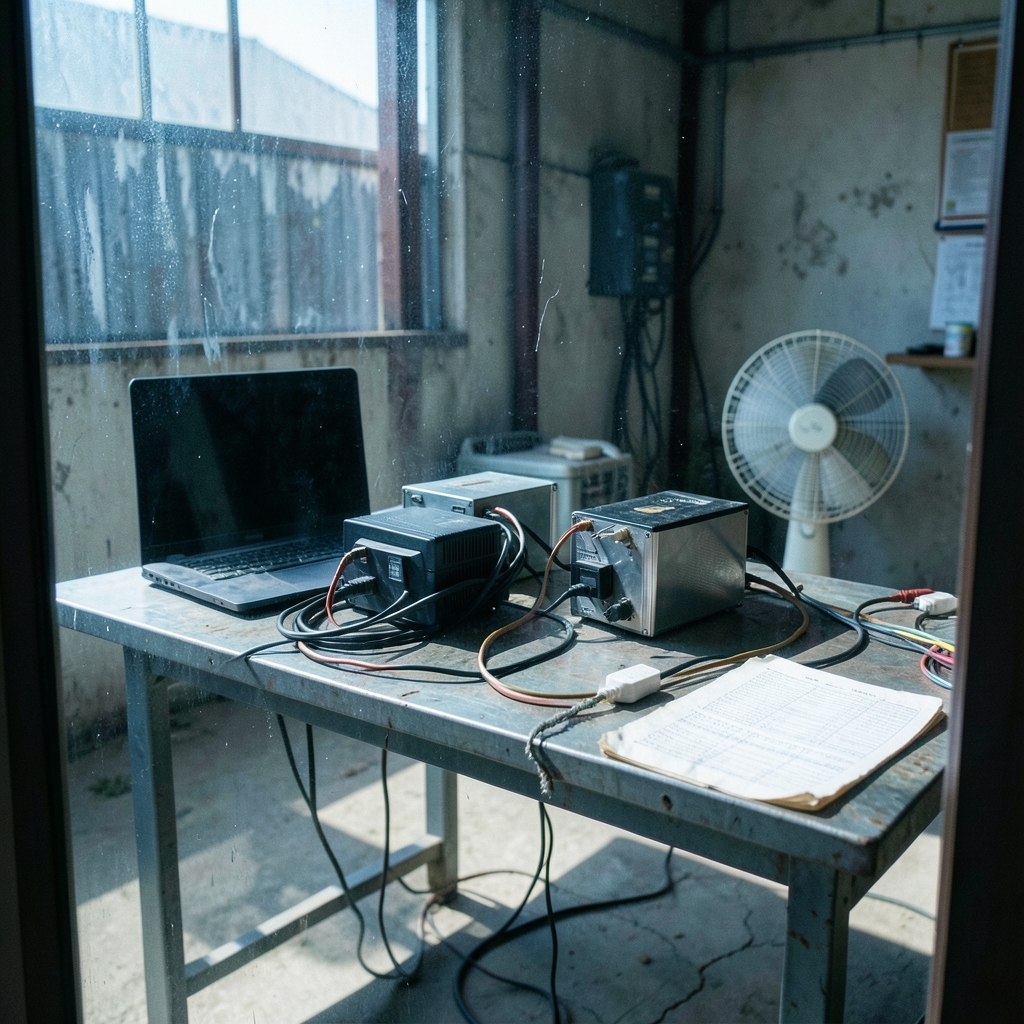
Not all pool fees work the same way. The percentage on the tin tells you how much the pool takes, but the payout scheme tells you who carries the risk. These are different things, and conflating them is one of the most common mistakes in mining economics.
| Payout Scheme | How You Get Paid | Who Bears Variance Risk | Typical Fee Level |
|---|---|---|---|
| PPS (Pay-Per-Share) | Fixed amount per accepted share | Pool | Higher |
| FPPS (Full Pay-Per-Share) | PPS plus a share of transaction fees | Pool | Higher still |
| PPLNS (Pay-Per-Last-N-Shares) | Paid only when the pool finds blocks | Miner | Lower |
| PPS+ | PPS for block rewards, PPLNS for fees | Mixed | Middle |
The logic is straightforward once you see it. Under PPS, the pool pays you whether or not it finds a block, so it must hold reserves to cover the bad stretches. That reserve requirement is why PPS fees run higher. Under PPLNS, you only get paid when the pool actually finds blocks, so your income swings with luck, but the fee is typically lower because the pool is not absorbing variance on your behalf.
A calculator that lets you toggle between PPS and PPLNS is doing real work. A calculator that only shows one fee percentage is hiding half the picture. If you want to see how this kind of flat-fee versus variable-fee comparison plays out in other software categories, the breakdown of affiliate marketing tools pricing comparison flat fees vs usage-based models follows similar logic: the headline price rarely tells the whole story.
Hidden Costs the Fee Percentage Never Shows
Here is where most people get burned. The pool fee is often the smallest line item in the real cost stack. A calculator that only multiplies hashrate by pool fee can miss costs that dominate the entire equation.
Electricity
This is usually the biggest cost of all. A miner running at 3,000 watts for 24 hours consumes 72 kWh. At $0.10 per kWh, that is $7.20 per day, every day, whether or not the pool finds a block. A 2% pool fee on a modest daily payout might be a dollar or two. Electricity can easily be five times that.
Hardware Depreciation
ASICs do not last forever, and their resale value falls as newer, more efficient models ship. A rig that cost $4,000 and lasts three years is effectively burning over $100 a month in capital, before you plug anything in. Most fee calculators ignore this entirely.
Stale and Rejected Shares
Effective yield depends on accepted shares, not submitted shares. High stale rates quietly reduce real income below what a naive calculation shows. If your connection is flaky or your pool is distant, you may be losing a percent or two to shares that never count. That is roughly the same magnitude as the pool fee itself, and it never appears in the calculator.
Payout Thresholds and Withdrawal Fees
Many pools impose minimum payout amounts and charge network transaction fees on withdrawals. A pool with a low percentage fee but a high withdrawal minimum can cost you more than a pool with a slightly higher percentage and cheap, frequent payouts. This is the same trap that shows up in SaaS pricing, where AI meeting tools pricing comparison seat fees vs bundled AI reveals how per-seat charges and bundled allowances produce very different totals depending on usage. The lesson transfers: compare total cost of ownership, not headline rates.
Why Calculator Outputs Go Stale So Fast
A calculator’s answer has a shelf life measured in days. Two forces keep moving the target.
Difficulty adjustment. As total network hashrate rises, your fixed share of the pie shrinks. A calculator that assumes constant difficulty will overstate long-run earnings, sometimes badly. If the network hashrate doubles over a year, your share halves, and no fee percentage change can compensate for that.
Block reward changes. Bitcoin’s subsidy halves roughly every four years. The April 2024 halving cut it from 6.25 to 3.125 BTC. Any calculator built before that date and not updated will report earnings roughly double what they should be. When you use a calculator, check when it was last updated. If the page does not say, assume it is stale.
The practical fix is to model a range, not a point. Run the numbers at current difficulty, at 20% higher difficulty, and at 50% higher difficulty. If the project only survives the best case, it does not survive.
The Risks a Fee Calculator Cannot Show You
Numbers are comforting. But some of the biggest risks in pooled mining are structural, and no spreadsheet captures them.
Counterparty and Solvency Risk
PPS pools pay miners regardless of whether the pool finds blocks. That means the pool must hold reserves to cover unlucky periods. If it cannot, payouts can be delayed or lost. This is a structural risk distinct from the fee percentage, and it is the reason a slightly higher fee at a well-capitalized pool can be worth paying. A calculator will happily show you the cheaper option without mentioning that the cheaper option might not be able to pay.
Pool Concentration
If a large share of network hashrate sits in a handful of pools, the network’s decentralization weakens. For individual miners this is a collective-action problem: the cheapest pool is not always the healthiest choice for the ecosystem you depend on.
Operational Risk
Pool outages, DDoS attacks, API failures, and payout bugs all happen. A pool with a 1% fee and 99.5% uptime may deliver less than a pool with a 2% fee and near-perfect reliability. Uptime is not on the calculator.
Regulatory and Tax Treatment
Mining income and pool payouts may be treated differently for tax purposes depending on where you live, and a fee calculator accounts for none of it. The reporting landscape is shifting too; the OECD has published a crypto-asset reporting framework that many jurisdictions are using as a template for exchange-of-information rules. If you mine at any scale, keep clean records of payouts and dates.
Smart Contract and Custody Risk
If your mined coins sit in a pool wallet or are routed through a third-party service, you are trusting that custodian. Fee calculators assume the coins arrive. They do not model what happens if they do not.
How to Use a Fee Calculator Without Getting Fooled
A calculator is a starting point, not an answer. Here is a workflow that actually holds up in practice.
- Enter your real hashrate and power draw. Not the spec sheet number. The number you observe after a week of running.
- Add electricity at your actual rate, including any demand charges or time-of-use tiers.
- Set difficulty growth to something pessimistic. Try 30% annualized and see if the project still works.
- Compare at least three pools on total cost: fee percentage, payout threshold, withdrawal fee, and uptime history.
- Model stale shares at 1–2% unless you have measured your own rate and know it is better.
- Re-run the numbers monthly. Treat the output as perishable.
The most common mistake is treating the calculator’s daily earnings figure as income rather than revenue. It is revenue. Profit comes after electricity, hardware amortization, and the quiet costs. The second most common mistake is comparing pools on fee percentage alone, which is like choosing a bank account on interest rate while ignoring monthly maintenance fees.
If you enjoy structured problem-solving and want a low-stakes way to sharpen that muscle, a daily mini crossword is a decent warm-up. And if you are the type who likes to understand the mechanics before diving in, this guide on how to play mini crossword covers the basics without wasting your time.
Practical Tips That Save Real Money
A few habits separate miners who last from miners who quit after two bad months.
Watch your effective yield, not your submitted hashrate. Track accepted shares over a week. If your stale rate is above 2%, investigate your connection, your pool’s location, and your miner’s firmware before blaming the pool fee.
Read the payout schedule, not the marketing page. Look for the minimum payout, the withdrawal fee, and whether the pool pays transaction fees to miners (FPPS and PPS+ do; plain PPS usually does not).
Diversify pools if you run serious hardware. Splitting hashrate across two pools reduces the damage from a single pool’s outage or payout failure. It also costs you nothing in fee terms if you pick pools with similar rates.
Keep a cost log. Electricity, hardware, pool fees, withdrawal fees. After three months you will know your true break-even hashprice, and no calculator can tell you that.
Do not chase the lowest fee blindly. A pool charging 1% that pays late is worse than a pool charging 2.5% that pays on time, every time. Reliability compounds.
For a deeper look at how alternative tools reduce cost and risk in other buying decisions, the analysis of sales prospecting tools alternatives that cut cost risk applies the same total-cost lens. The pattern is universal: the sticker price is the beginning of the conversation, not the end.
Conclusion
Mining pool fee calculators are genuinely useful, but only if you understand what they leave out. They measure a fee percentage. They do not measure electricity, hardware decay, stale shares, payout thresholds, counterparty solvency, or difficulty drift. The miners who do well are the ones who treat the calculator as a first draft and then build the rest of the model themselves. Run pessimistic assumptions, compare total costs rather than headline rates, and re-check your numbers every month. The fee is real, but it is rarely the thing that decides whether mining pays.
Frequently Asked Questions
What is a mining pool fee calculator?
It is a tool that estimates your earnings from pooled mining by combining your hashrate, the pool fee percentage, network difficulty, and the block reward. Most produce a daily or monthly revenue figure before electricity and hardware costs. Treat the output as a rough starting point rather than a reliable forecast.
Is a lower pool fee always better?
No. A pool with a 1% fee but high withdrawal minimums, slow payouts, or poor uptime can cost more than a pool charging 2.5% with clean, frequent payouts. Compare total cost of ownership, including payout thresholds, withdrawal fees, and reliability, rather than the percentage alone.
What is the difference between PPS and PPLNS?
Under PPS (Pay-Per-Share), the pool pays a fixed amount per accepted share regardless of whether it finds a block, so the pool absorbs variance and charges a higher fee. Under PPLNS, you are paid only when the pool finds blocks, so your income swings more but fees are typically lower.
Why do calculator results change so often?
Two forces move constantly: network difficulty, which adjusts roughly every two weeks, and the block reward, which halves about every four years. When difficulty rises, your fixed hashrate commands a smaller share of rewards. Any calculator output is a snapshot with a shelf life of days or weeks.
Do pool fee calculators include electricity costs?
Most do not, or they include it only as an optional field. Electricity is usually the largest single cost in mining, often several times the pool fee itself. You need to add your own power draw and rate to get anything close to a real profit figure.
What risks do fee calculators miss entirely?
Counterparty and solvency risk (especially with PPS pools that must hold reserves), pool concentration and decentralization concerns, operational outages, stale and rejected shares, payout delays, and tax treatment. None of these appear in a standard fee calculation, yet any of them can wipe out a thin margin.




